Web UI
The GlassFlow web interface provides an intuitive, visual way to create and manage data pipelines without writing code. This guide walks through the complete process of setting up pipelines, monitoring their state, and managing their lifecycle.
Accessing the Web UI
When running locally via the CLI, the web interface is available at http://localhost:30080 after glassflow up. For Kubernetes deployments, use the URL exposed by your ingress or service.
Creating a Pipeline
Click Create in the top navigation. The first step is to choose your data source:
- Apache Kafka: consume messages from one or more Kafka topics, with support for deduplication, joins, filtering, and stateless transformations.
- OpenTelemetry (OTLP): receive OpenTelemetry logs, traces, or metrics directly via the OTLP protocol, no Kafka required.
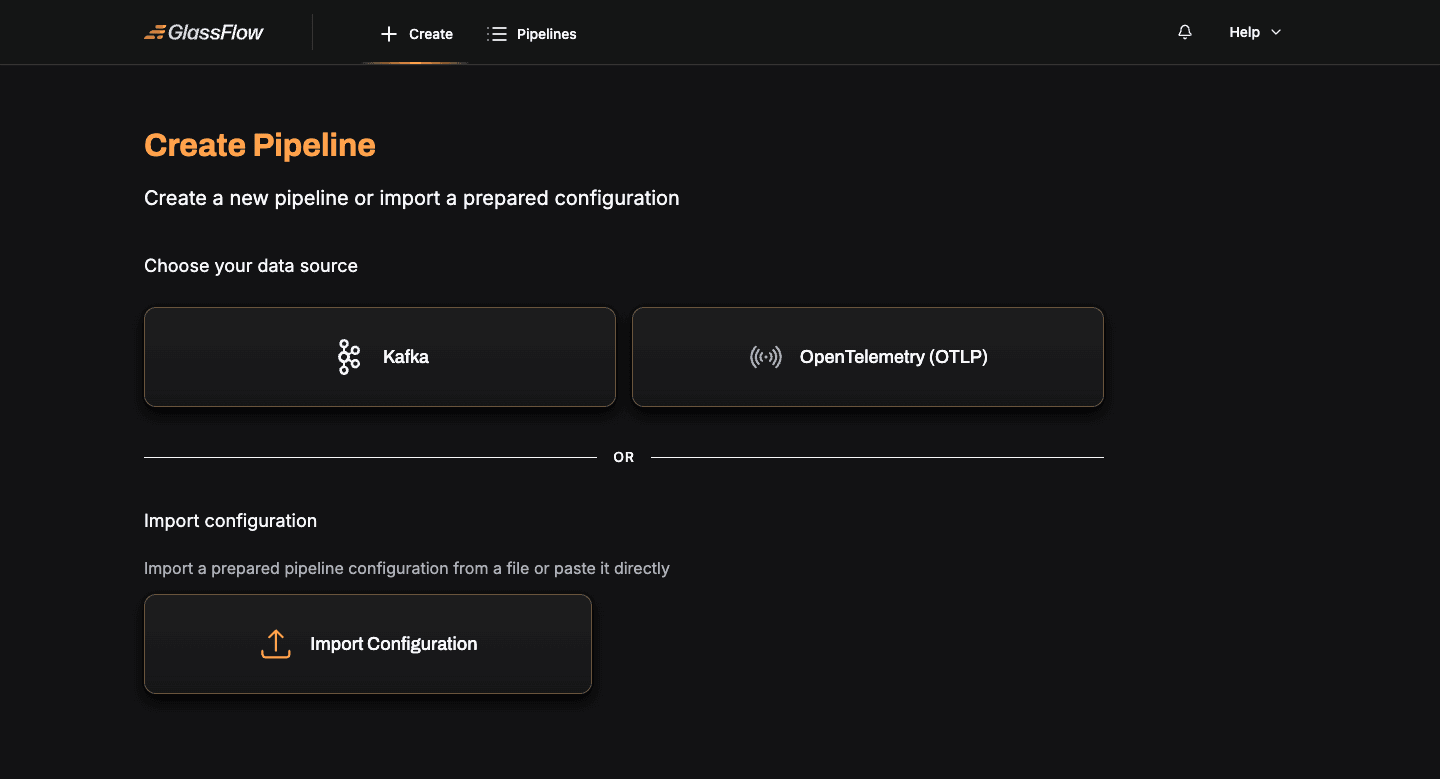
Each source has its own guided wizard. Pick the source you want and follow the matching guide:
You can also import a pre-built pipeline configuration JSON via the Import Configuration card on the same page.
Pipeline Management
After deployment, every pipeline appears in the Pipelines list. From there you can monitor activity, stop, resume, edit, or delete a pipeline.
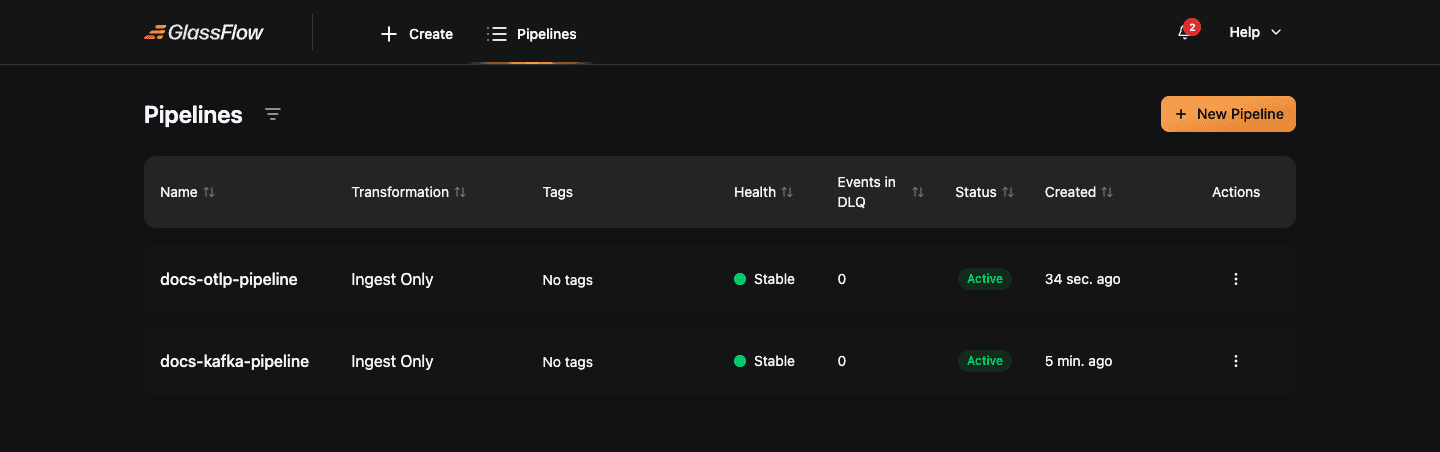
Open a pipeline to see its live monitoring view, DLQ metrics, ClickHouse insert rate, and a visual representation of the source-to-sink topology.
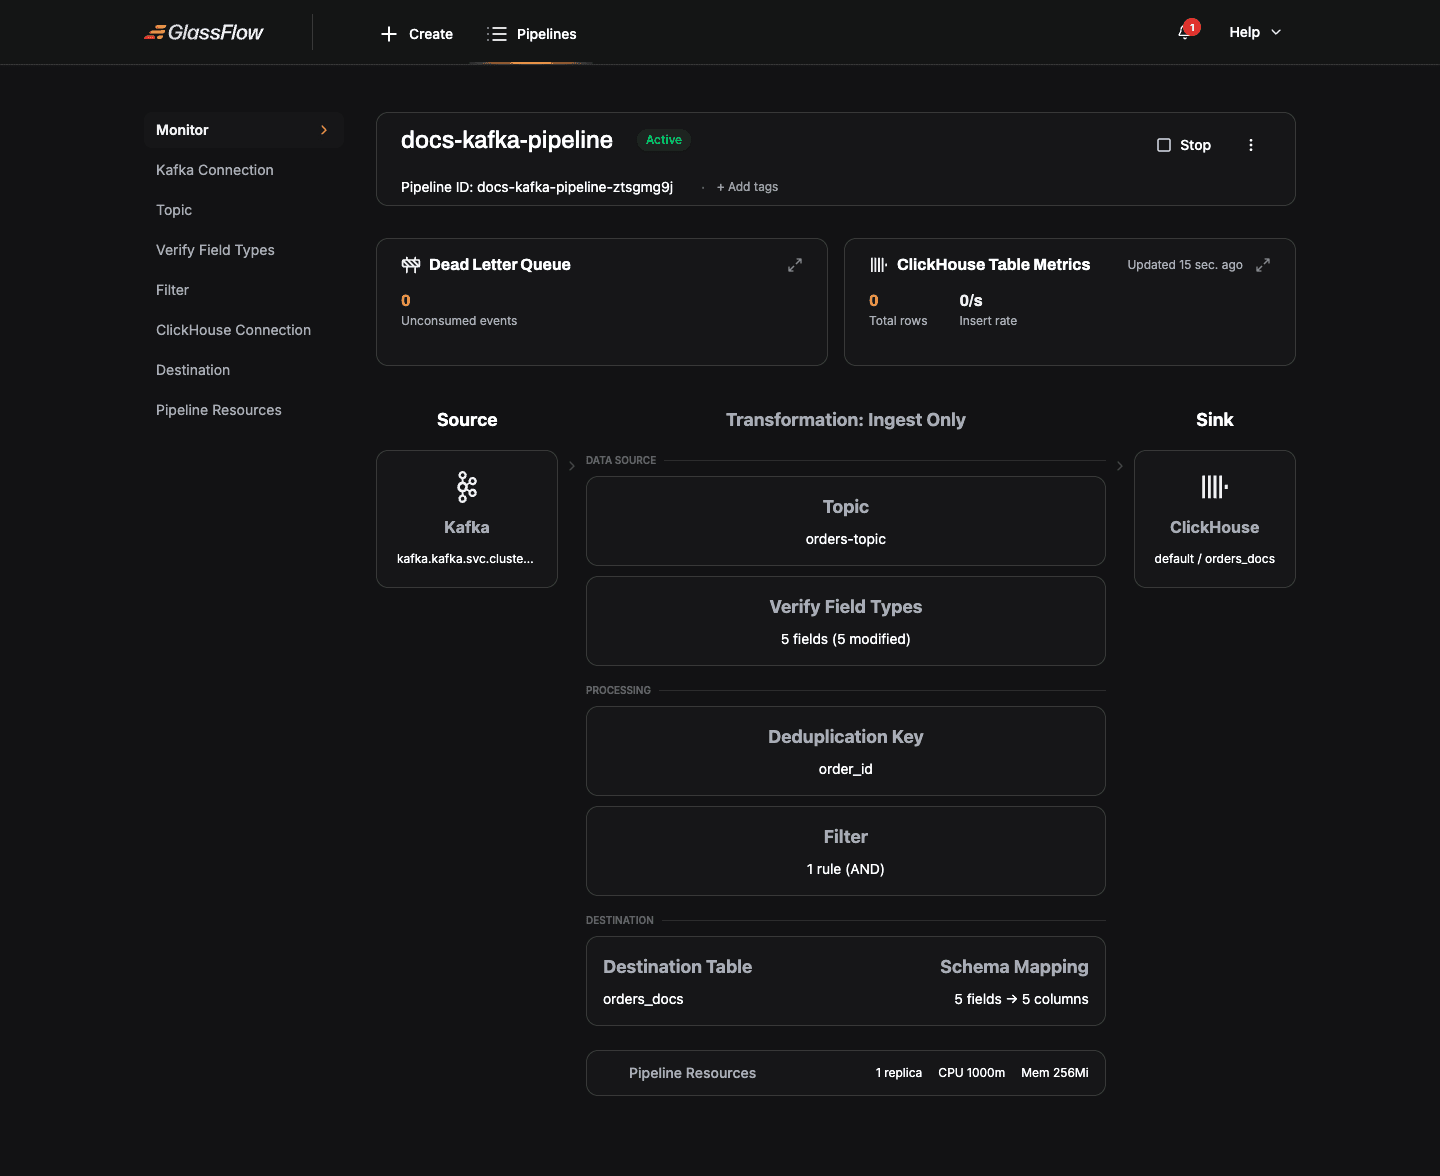
Lifecycle actions
| Action | Description |
|---|---|
| Stop | Stops ingesting new messages; drains the in-flight queue, then scales components down to zero replicas. |
| Terminate | Stops ingesting and scales components to zero immediately, without draining. |
| Resume | Brings a stopped or terminated pipeline back to Running by scaling components back up. |
| Edit | Available only for pipelines in Stopped or Terminated state. All pipeline configuration can be edited. |
| Delete | Available only for pipelines in Stopped or Terminated state. Permanently removes the pipeline and its NATS JetStream streams. |
Pipeline States
Every pipeline moves through a defined set of states. Understanding these states helps you interpret the dashboard, respond to failures, and avoid invalid operations.
| State | Type | Description |
|---|---|---|
Created | Stable | The pipeline configuration has been saved but the pipeline has never been started. No Kubernetes workloads are running. |
Running (shown as Active) | Stable | The pipeline is actively consuming from its source, processing data, and writing to ClickHouse. |
Stopping | Transitional | A stop has been requested. The pipeline is draining in-flight messages from the queue before scaling down to zero replicas. |
Stopped | Stable | The pipeline has scaled down to zero replicas. No data is being processed. Configuration is preserved and the pipeline can be resumed or deleted. |
Resuming | Transitional | A resume has been requested. Kubernetes workloads are scaling back up. The pipeline transitions to Running once all components are healthy. |
Terminating | Transitional | A terminate has been requested. The pipeline is scaling down immediately, without waiting to drain the queue. |
Failed | Stable | A system-level failure has occurred that the pipeline cannot recover from automatically (for example, a Kubernetes workload crash or an unrecoverable NATS error). |
Transitional states (Stopping, Resuming, Terminating) are temporary. The pipeline moves through them automatically; you cannot directly request a transitional state. While a pipeline is in a transitional state, most operations are blocked, the exception is that Terminating can always be requested from any non-terminal state.
Best Practices
1. Connection security
- Use
SASL_SSLorSSLfor production Kafka clusters; reservePLAINTEXTfor local development. - Use the
Use SSLtoggle on the ClickHouse step when connecting to managed ClickHouse offerings (ClickHouse Cloud, Aiven, etc.). - Test connections before deploying, the wizard validates them at each step.
2. Schema design
- Use clear, consistent field names. The schema you define in the wizard maps directly to ClickHouse column names.
- Use appropriate ClickHouse data types in the Mapping step (e.g.
Float32for amounts,DateTime64for timestamps).
3. Performance tuning
- Adjust Max Batch Size and Max Delay Time in the Mapping step based on your write rate. Defaults (1000 records / 1 minute) suit most pipelines up to ~10K rps.
- For higher throughput, increase ingestor/sink Replicas in the Pipeline Resources step. Kafka ingestor replicas are capped at the topic’s partition count.
- See the Scaling Guide for replica and resource recommendations against specific throughput targets.
Troubleshooting
Connection failures
- Verify network connectivity (
kubectl execinto the GlassFlow API pod and check DNS resolution). - Check authentication credentials match exactly what the broker / database expects.
- For TLS connections, ensure the broker’s CA is reachable or toggle Skip Certificate Verification for development clusters.
Schema mismatches
- The wizard infers field types from a sample event. If your topic has heterogeneous events, pick one as the canonical shape and define the schema manually in Verify Field Types.
- ClickHouse column types must be compatible with the inferred type. The Mapping step shows the inferred type next to the destination column type, adjust the inferred type if needed.
Pipeline failures
- Open the pipeline’s detail page to view DLQ metrics. A growing DLQ usually points to a schema mismatch or a permanent ClickHouse error (e.g. a constraint violation).
- For deeper diagnosis, check pipeline logs via
kubectl logsand review the Pipeline Configuration Reference.
Getting help
- Consult the FAQ for common solutions.
- Read the Pipeline Configuration Reference for the underlying JSON schema each wizard step produces.
Next Steps
- Create a Kafka pipeline, step-by-step wizard walkthrough for Kafka sources
- Create an OTLP pipeline, step-by-step wizard walkthrough for OTLP sources
- Pipeline Configuration Reference, full JSON configuration documentation
- Monitoring and observability, verify data is flowing end-to-end