Creating an OTLP Pipeline
This guide walks through the OTLP pipeline wizard step by step, picking the OpenTelemetry signal type, configuring optional dedup/filter/transform, mapping to ClickHouse, and deploying.
Unlike the Kafka wizard, the OTLP source has no connection step. GlassFlow runs its own OTLP receiver inside the cluster. Once the pipeline is deployed, you point your OpenTelemetry Collector or SDK at the receiver and tag every request with the pipeline’s ID. See Sending data for collector configs and SDK examples.
The OTLP receiver must be enabled in your GlassFlow Helm release (otlpReceiver.enabled=true). See OTLP source prerequisites.
Choose pipeline type
From the Create Pipeline page, click OpenTelemetry (OTLP) as your data source. A dialog asks for the pipeline name:
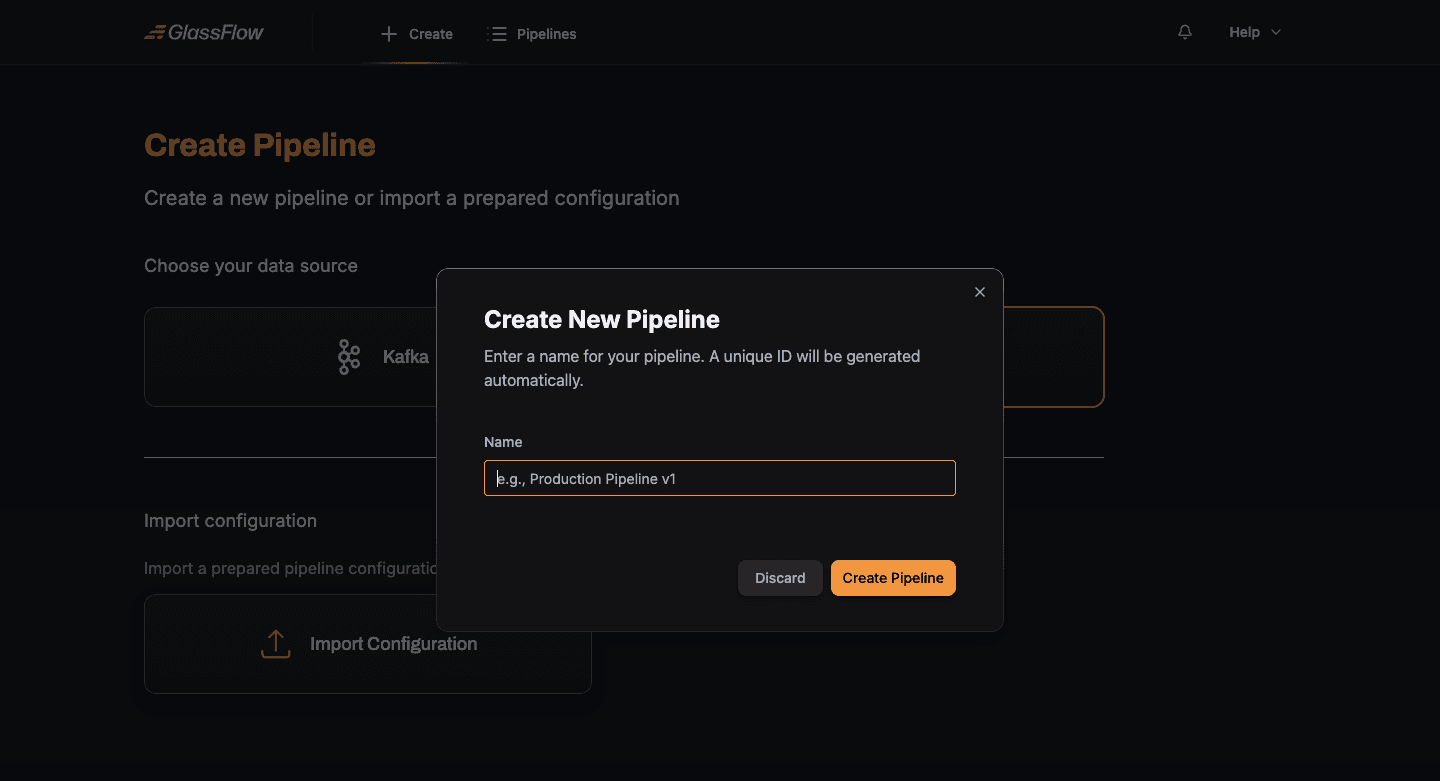
Enter a descriptive name and click Create Pipeline to enter the wizard.
Select Signal Type
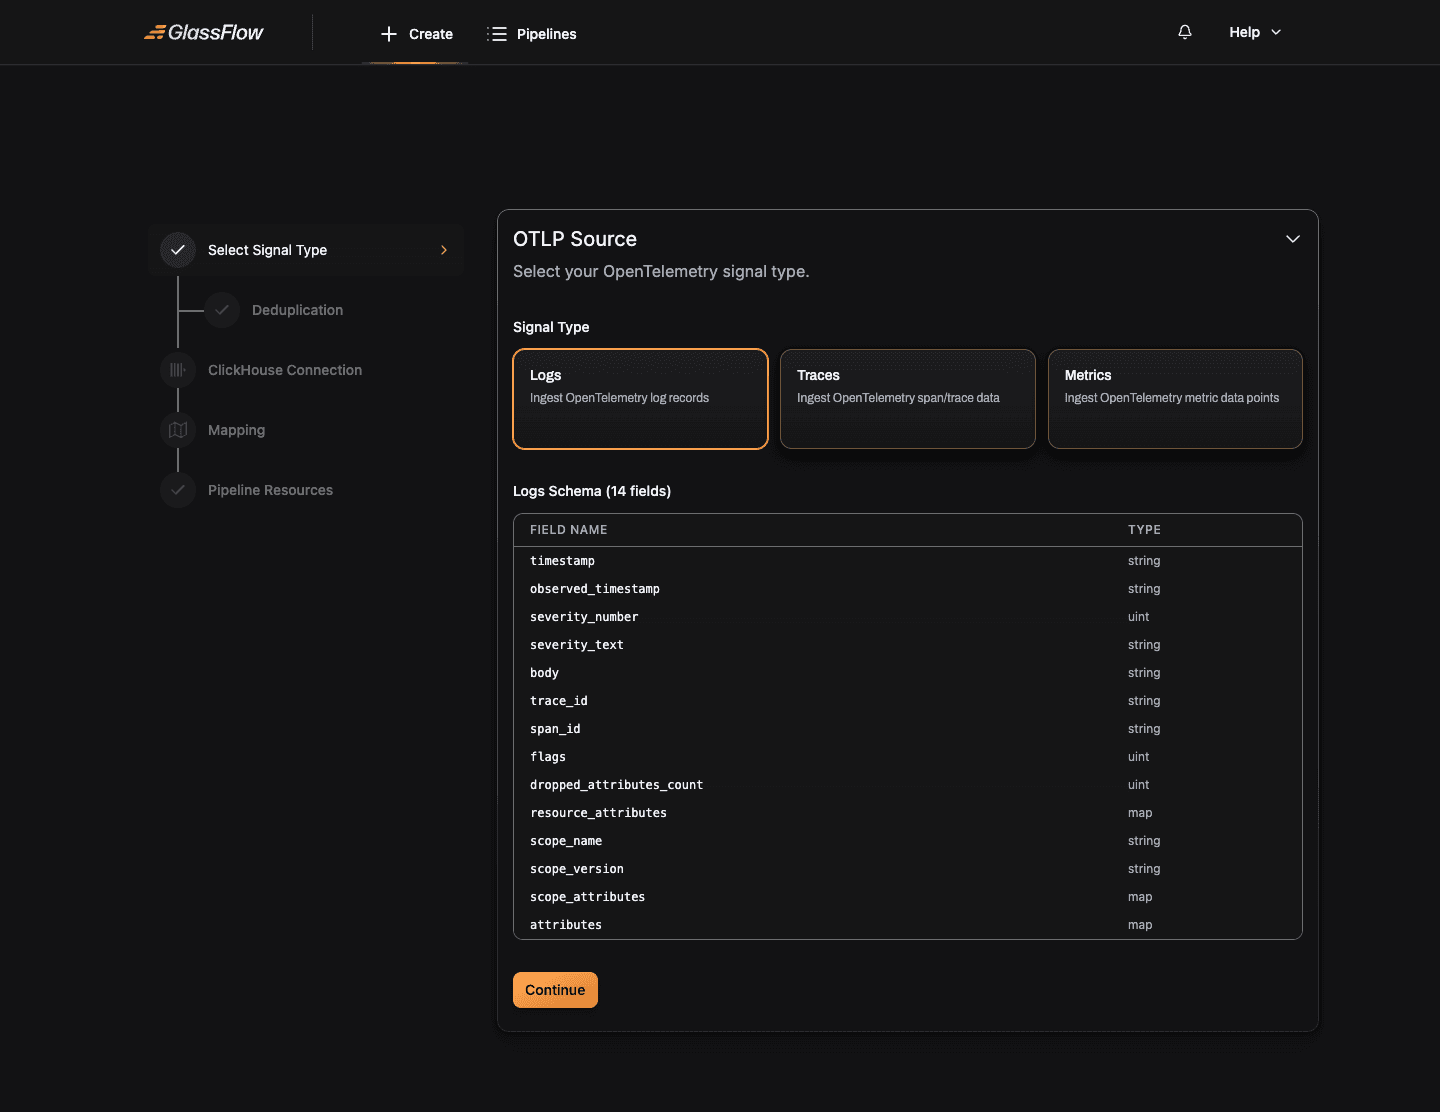
Pick which OpenTelemetry signal this pipeline ingests:
| Signal | Description |
|---|---|
| Logs | OpenTelemetry log records |
| Traces | Distributed trace spans |
| Metrics | Metric data points (gauge, sum, histogram, summary) |
Unlike Kafka, the OTLP source has a predefined schema per signal type: the fields and their types are dictated by the OpenTelemetry spec. The wizard shows the full schema in a table below the signal selector. You can’t add or remove fields here.
Click Continue when ready.
Configure Deduplication (optional)
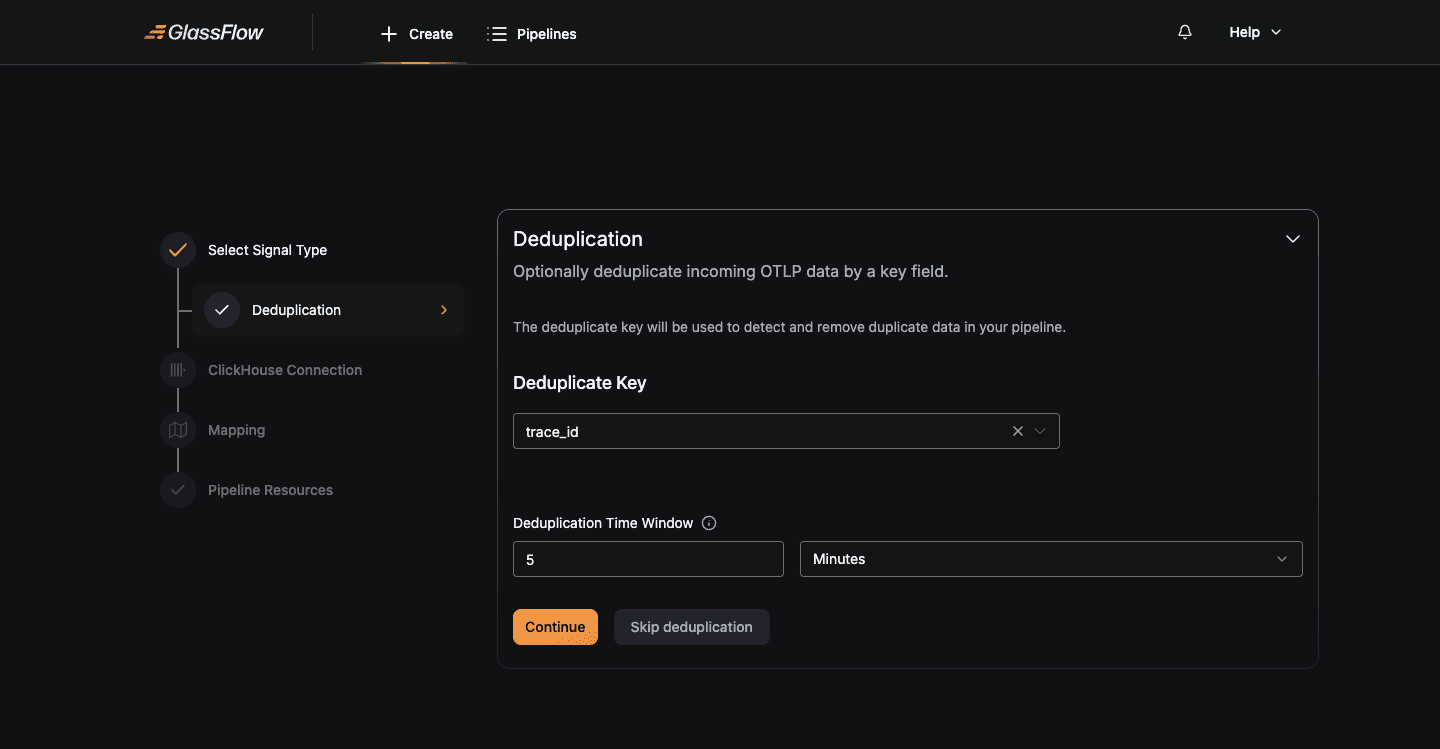
Deduplication drops repeat records based on a key and a time window. Skip this step if you don’t need it.
| Field | Description |
|---|---|
| Deduplicate Key | Field from the predefined OTLP schema (e.g. trace_id, span_id, timestamp). |
| Deduplication Time Window | A numeric value plus a unit (Seconds, Minutes, Hours). Records with the same key arriving within this window are dropped. |
Click Continue to keep the deduplication, or Skip deduplication to pass all records through unchanged.
Configure Filter (optional)
Filtering keeps only records that match a condition. This step is identical to the Kafka pipeline filter step. See the Filter step in the Kafka guide for the visual builder, expression mode, and grouping behavior.
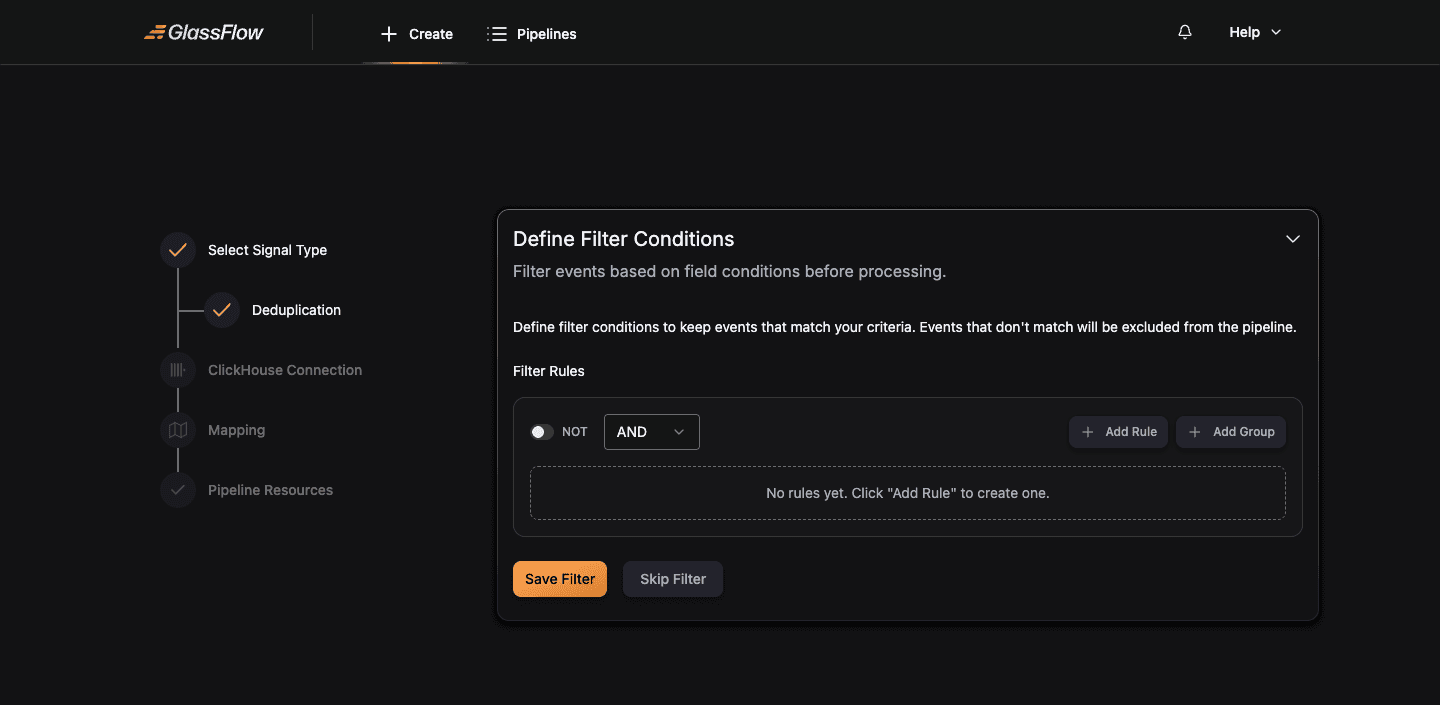
Click Save Filter to apply, or Skip Filter to pass all records through.
Configure Transform (optional)
Transformation lets you reshape each record before it reaches ClickHouse. Rename fields, derive new ones, drop fields you don’t need.
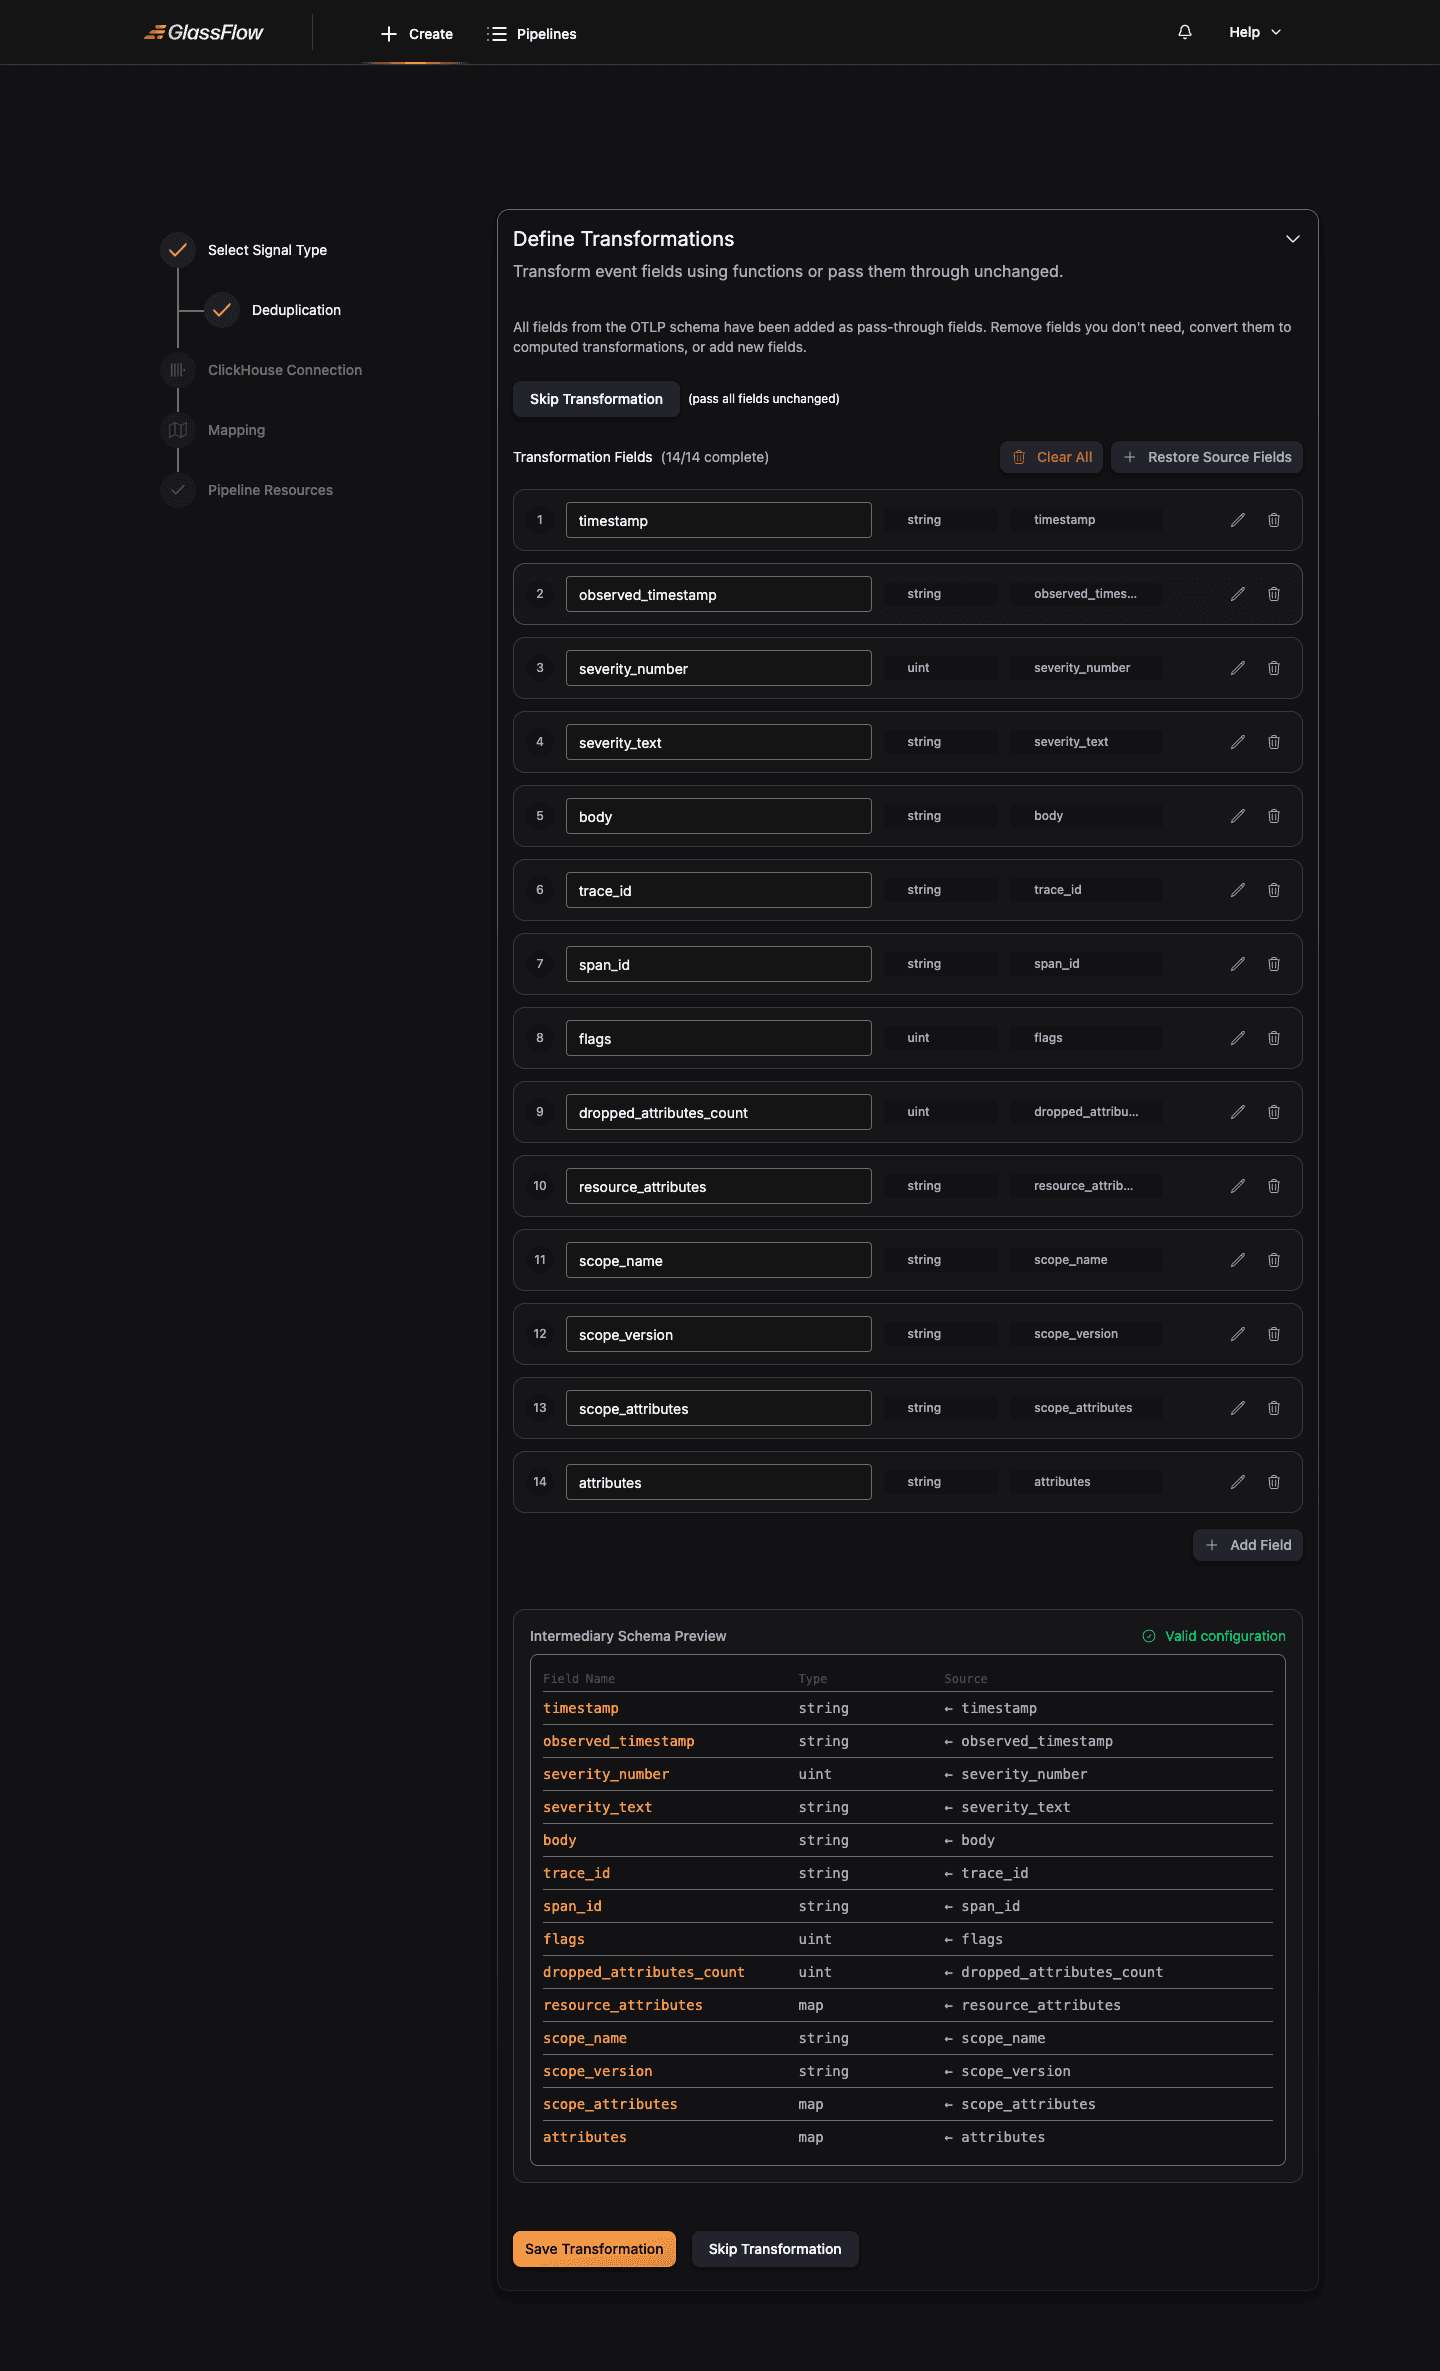
By default the wizard adds every OTLP field as a pass-through. The behavior matches the Kafka Transform step. You can rename, remove, add computed fields, restore defaults, or clear all.
Click Skip Transformation to pass all fields through unchanged, or Continue when your transformations are ready.
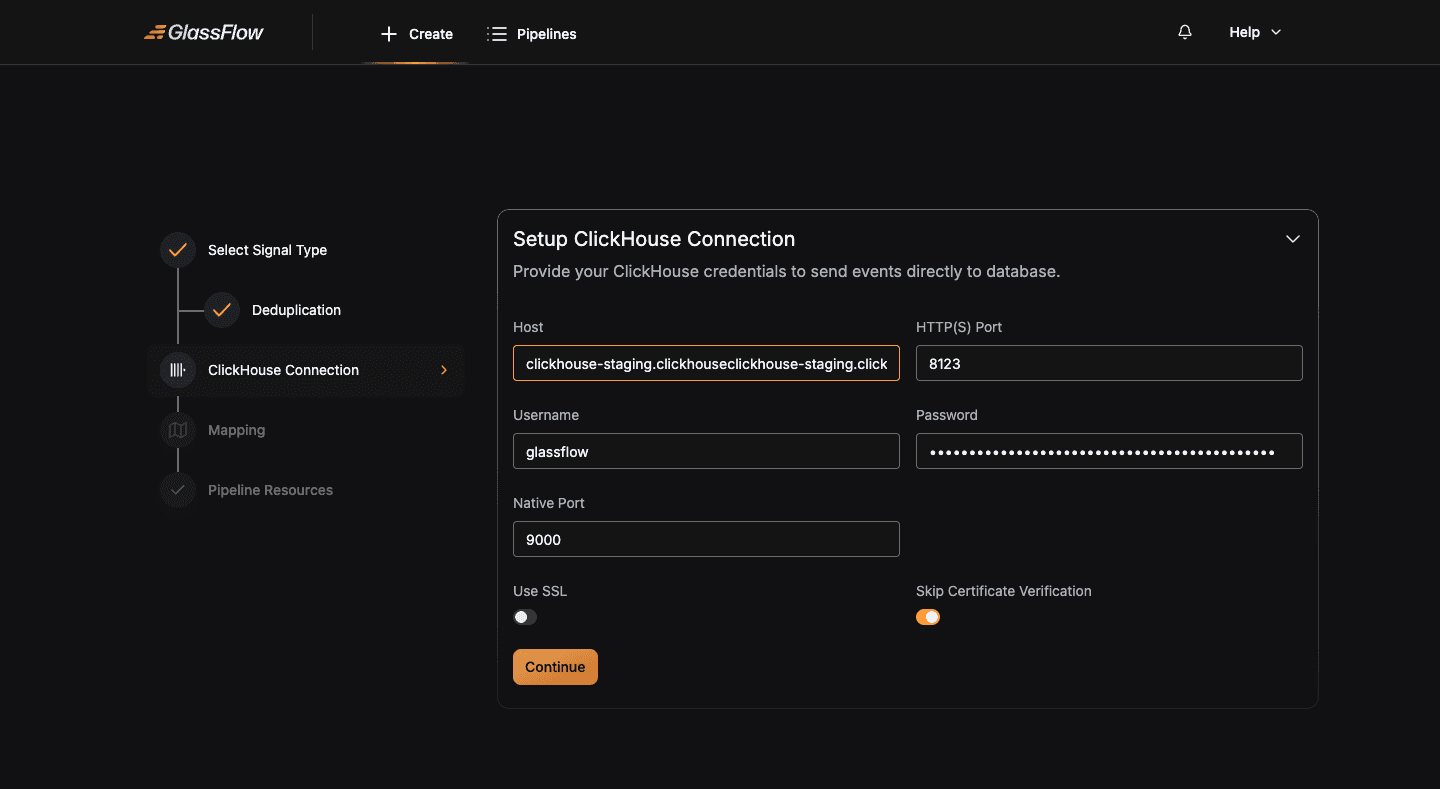
Setup ClickHouse Connection
Configure the connection to your destination ClickHouse cluster. The form is identical to the Kafka pipeline’s ClickHouse step:
| Field | Description |
|---|---|
| Host | Hostname or IP, without http:// or https:// prefix |
| HTTP(S) Port | HTTP port, 8123 for plain, 8443 for TLS |
| Username / Password | ClickHouse user credentials |
| Native Port | TCP/native port, 9000 for plain, 9440 for TLS |
| Use SSL | Enable for managed ClickHouse offerings (ClickHouse Cloud, Aiven, Altinity.Cloud) that require TLS |
| Skip Certificate Verification | Skip TLS certificate validation, useful for self-signed certs during development |
Click Continue. The wizard validates the connection.
Configure Mapping
Map OTLP fields to a ClickHouse table. The mapping step is the same as the Kafka pipeline. Pick Create New Table or Use Existing Table and configure the table and field mapping:
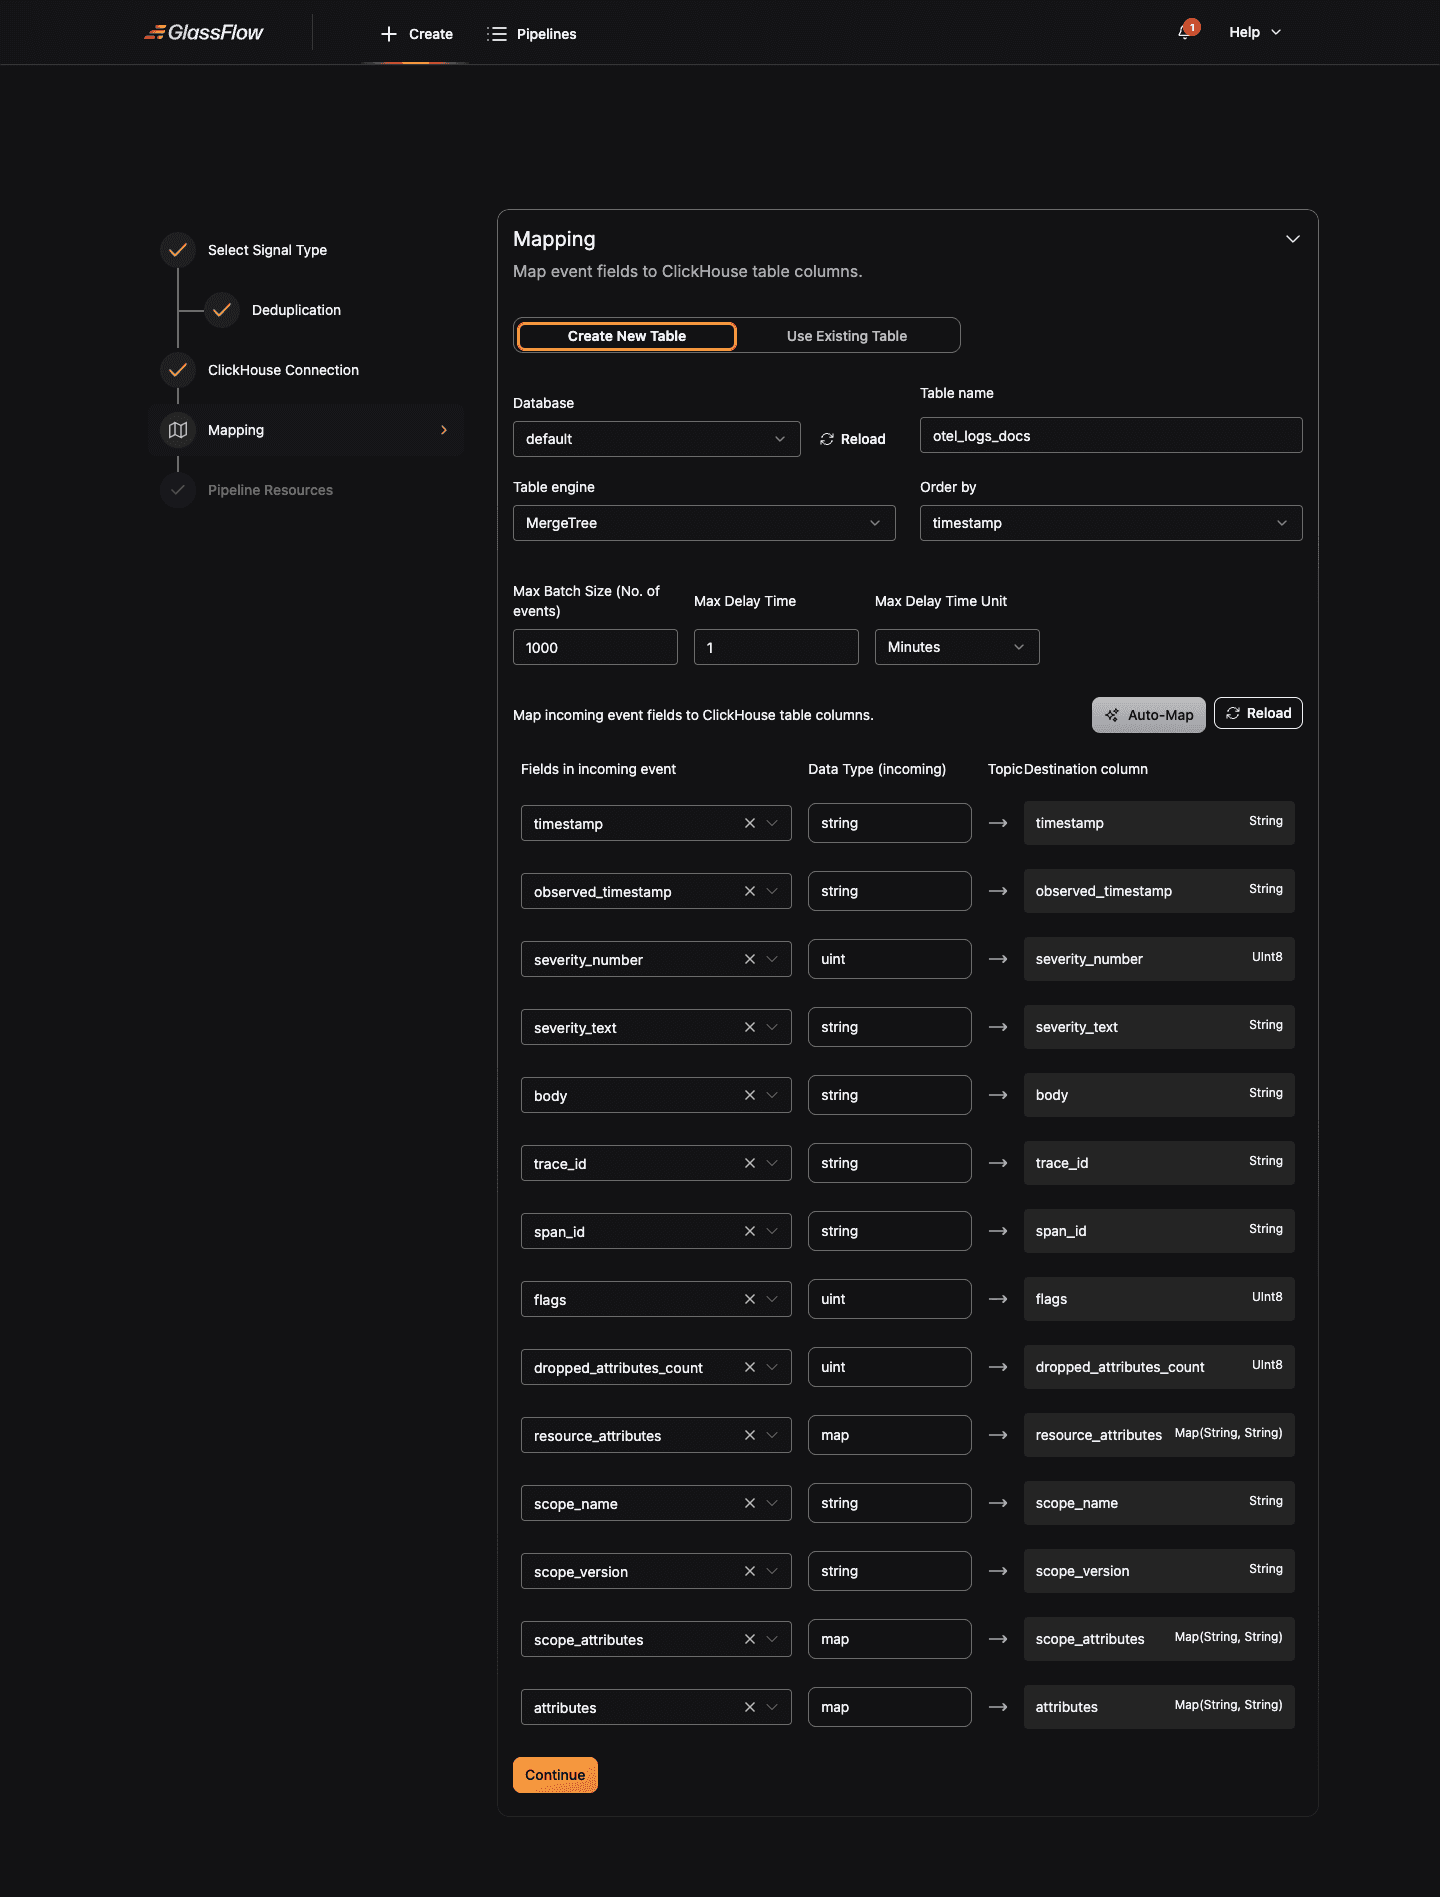
For Logs, the wizard pre-fills the mapping with all 14 OTLP log fields → matching ClickHouse columns. You can:
- Adjust the destination column name or type (e.g. cast
timestampfromStringtoDateTime64(9)) - Remove fields you don’t want in the table (e.g. drop
scope_attributesif you only care aboutattributes) - Pick a different Order by field,
timestampis a sensible default for log tables
Many users target a ClickStack -compatible schema (specific column names and types that the ClickStack observability UI expects). See OTLP examples for ready-to-use table definitions.
Click Continue when the mapping is complete.
Configure Pipeline Resources
OTLP pipelines have fewer components than Kafka pipelines because there’s no separate Kafka ingestor. The OTLP receiver is a shared cluster-wide component. The Pipeline Resources step lets you size the Sink and Transform/Dedup workers, plus the NATS buffer between them.
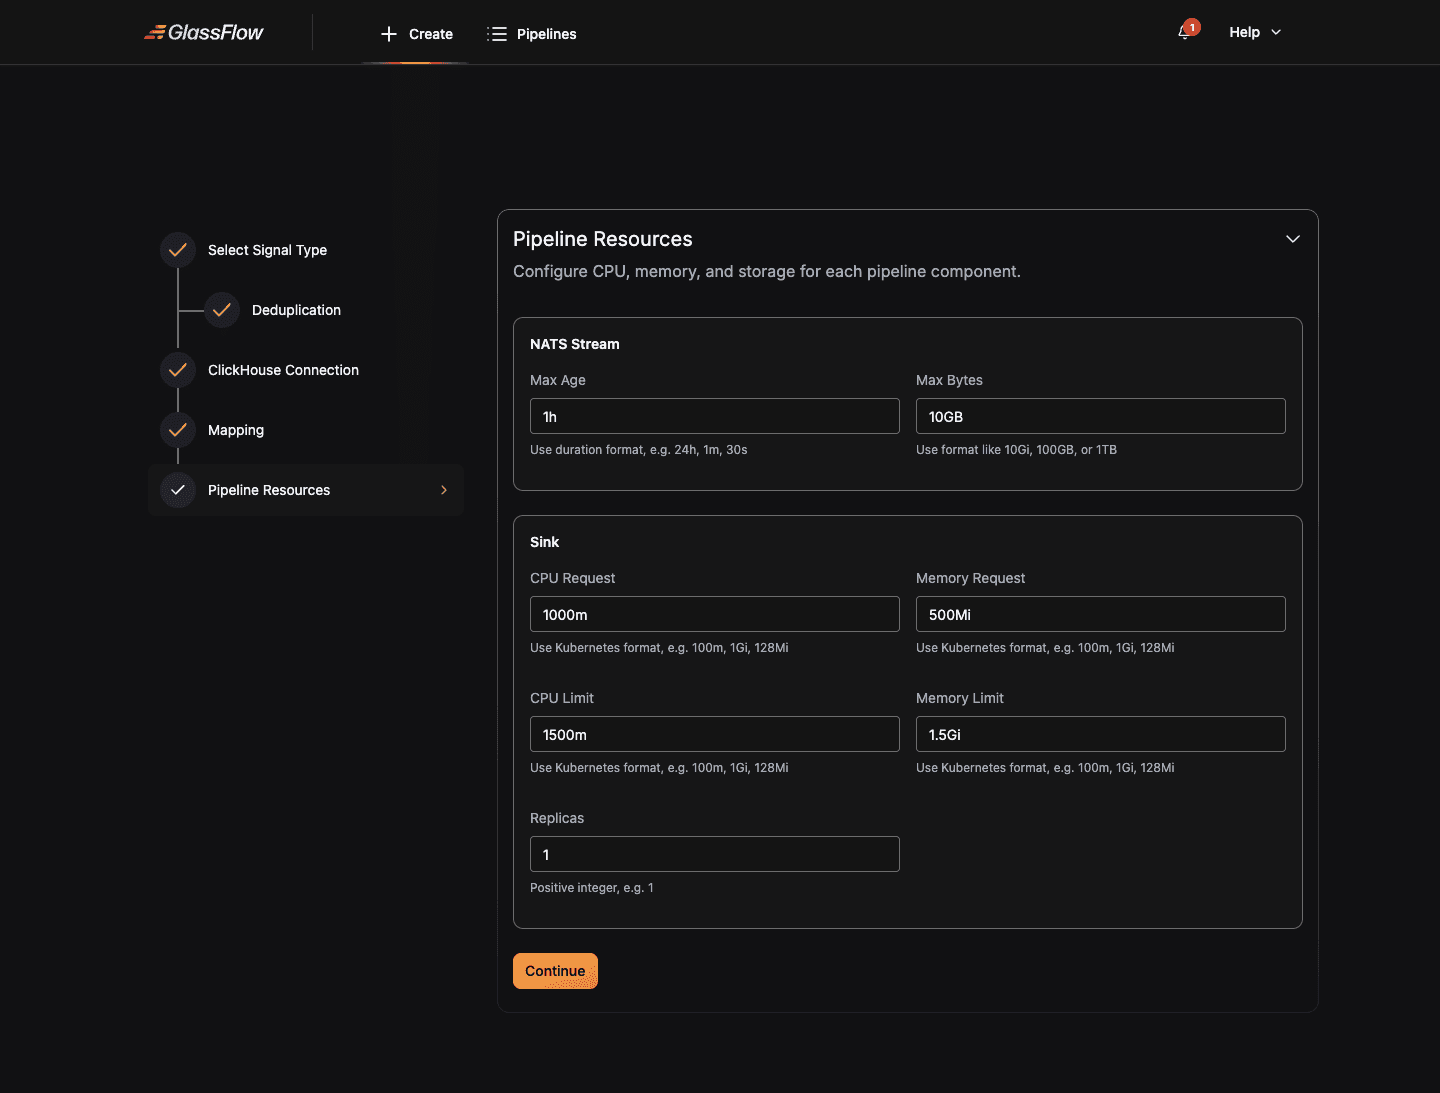
The configuration knobs match the Kafka pipeline’s. See Pipeline Resources in the Kafka guide for details on replicas, CPU/memory, and NATS stream settings. For tuning guidance against specific throughput targets, see the Scaling Guide.
Click Continue to deploy the pipeline.
Deploy
The wizard validates the configuration, sends it to the GlassFlow API, and provisions the Kubernetes workloads. Once all components are healthy, the pipeline transitions to Active.
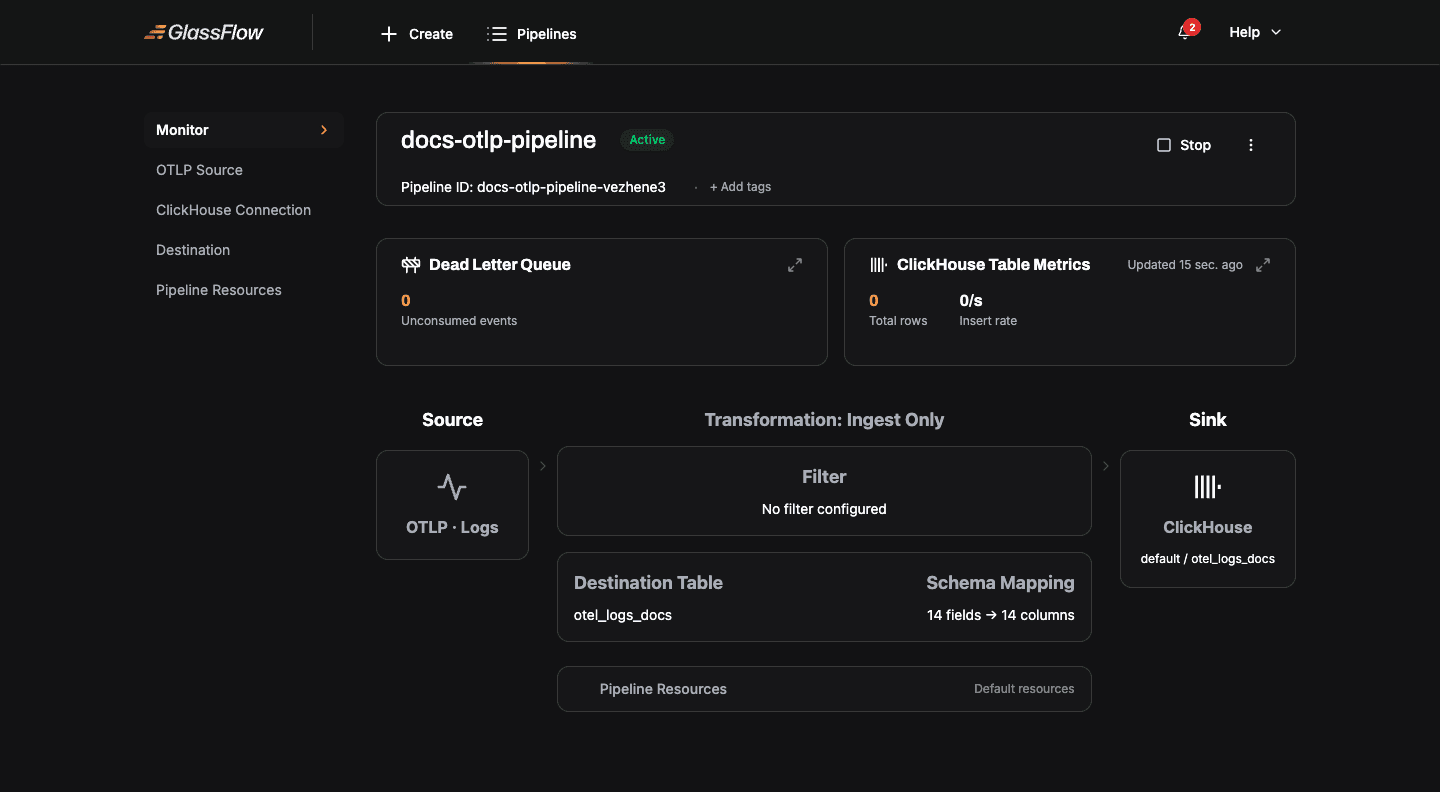
The pipeline detail page shows the same monitoring widgets as a Kafka pipeline: DLQ metrics, ClickHouse insert rate, visual source-to-sink flow, and lifecycle controls.
Sending Data to the Pipeline
After deployment, point your OpenTelemetry Collector or SDK at the GlassFlow OTLP receiver. Every OTLP request must carry the x-glassflow-pipeline-id header with the pipeline’s ID as the value. Without it, the receiver returns 400 Bad Request.
See Sending data for ready-to-use OTel Collector configs (HTTP and gRPC), SDK examples in Python/Go/Node.js, and signal-specific guidance.
Pipeline Stop / Terminate Behavior
Because the OTLP receiver is a shared component, it continues accepting incoming data for stopped or terminated pipelines. The events are buffered in NATS JetStream until the pipeline is resumed. See OTLP source, Pipeline Stop and Terminate behavior for details and the implications for max_bytes / max_age retention.
Backpressure
The OTLP receiver signals backpressure to upstream OTel Collectors and SDKs when the pipeline can’t keep up, returning 429 Too Many Requests (HTTP) or ResourceExhausted (gRPC). Standard OTel exporters retry these responses automatically. See Backpressure for tuning the two backpressure gates.
Next Steps
- Kafka pipeline guide, same wizard pattern for Kafka sources
- OTLP source documentation, protocol, ports, predefined schemas
- Sending data, OTel Collector configs and SDK examples
- OTLP examples, ClickStack-compatible table definitions and end-to-end demos
- Pipeline Configuration Reference, JSON schema each wizard step produces